SharePoint Analytics Measuring Intranet Engagement and ROI for long-term success
Learn how SharePoint Analytics connects intranet usage with business outcomes.
Many intranet owners face a similar problem. How can they ensure their portal’s success? They put a lot of effort into its delivery. They are afraid this energy will go to waste.
An effective intranet is not about features. It is not about the technology. It is about the value the portal delivers. And how often users utilize it. Focus should be on the outcomes, not the means to achieve them.
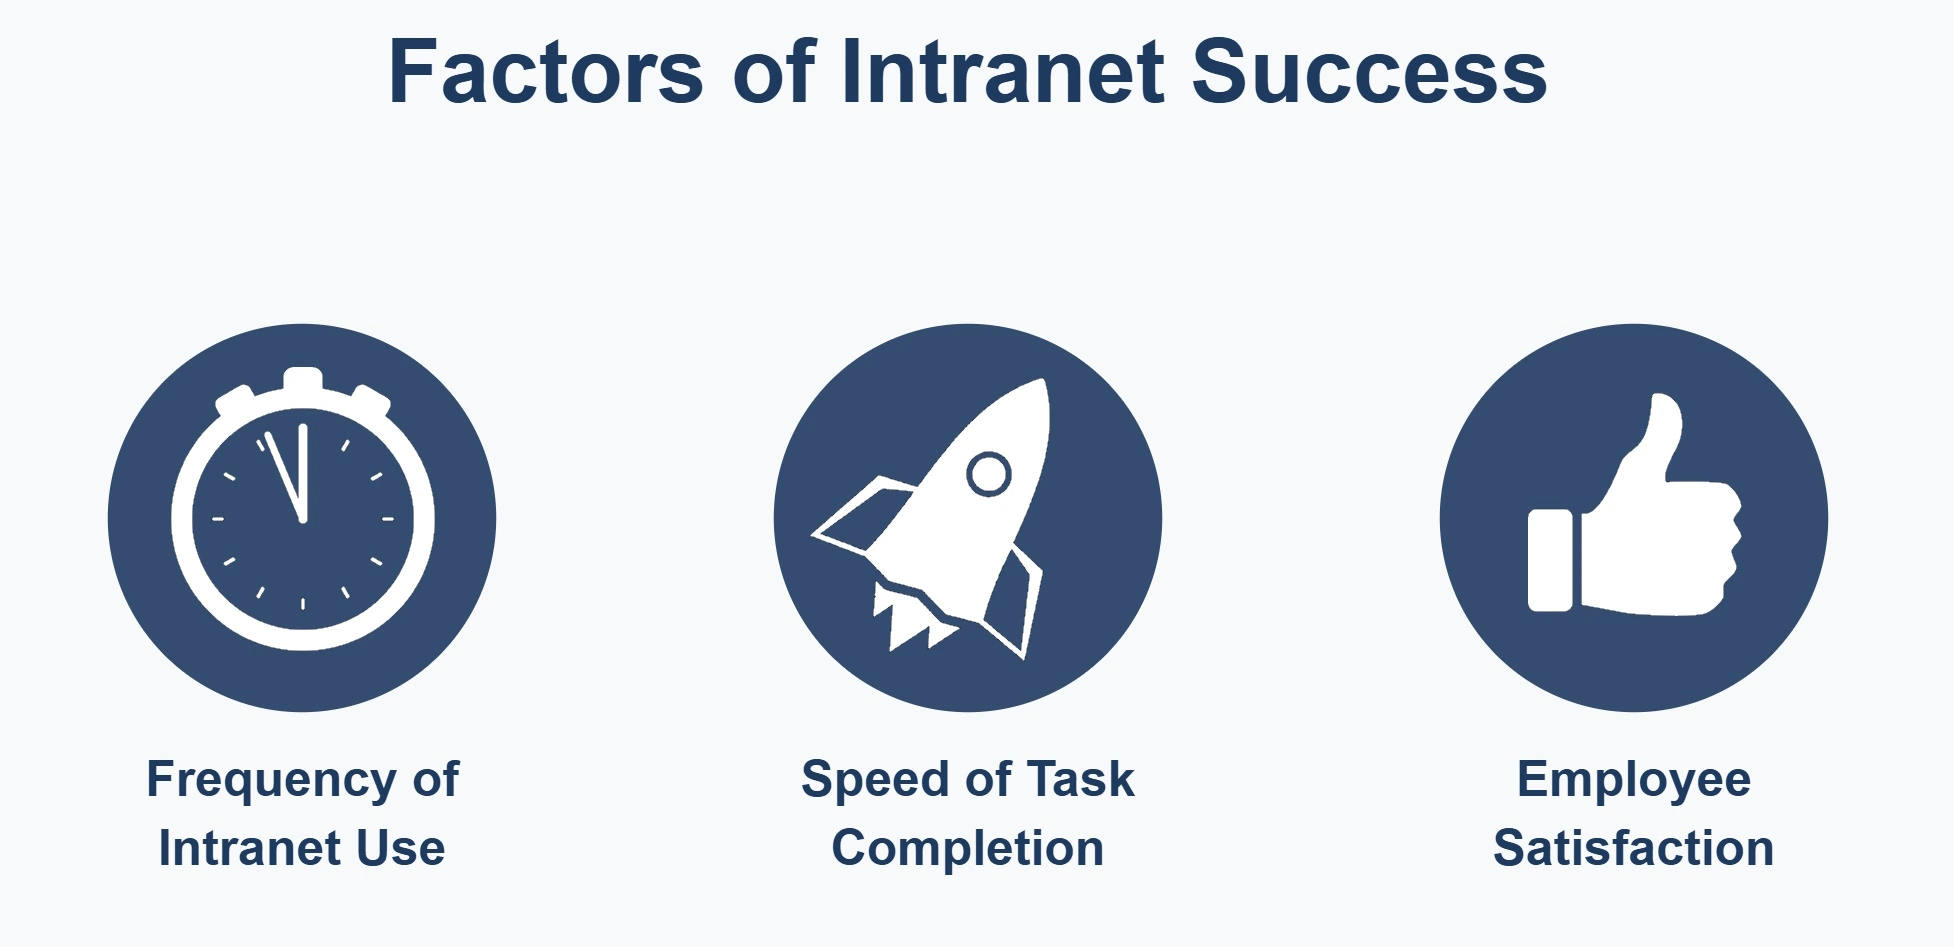
According to Nielsen Norman Group, frequency of use is one of 3 key intranet metrics. Frequency matters because it signals whether your intranet has become essential to daily work.
In this article, we focus on how to use SharePoint analytics to track intranet engagement and improve its user adoption. We will explore built-in options. We will also show how to extend them easily.
Built-In SharePoint Analytics Capabilities
Intranets built on SharePoint offer a variety of usage analytics functions. With SharePoint reporting, you can monitor the performance of individual pages, sites, and entire hubs.
Page Analytics
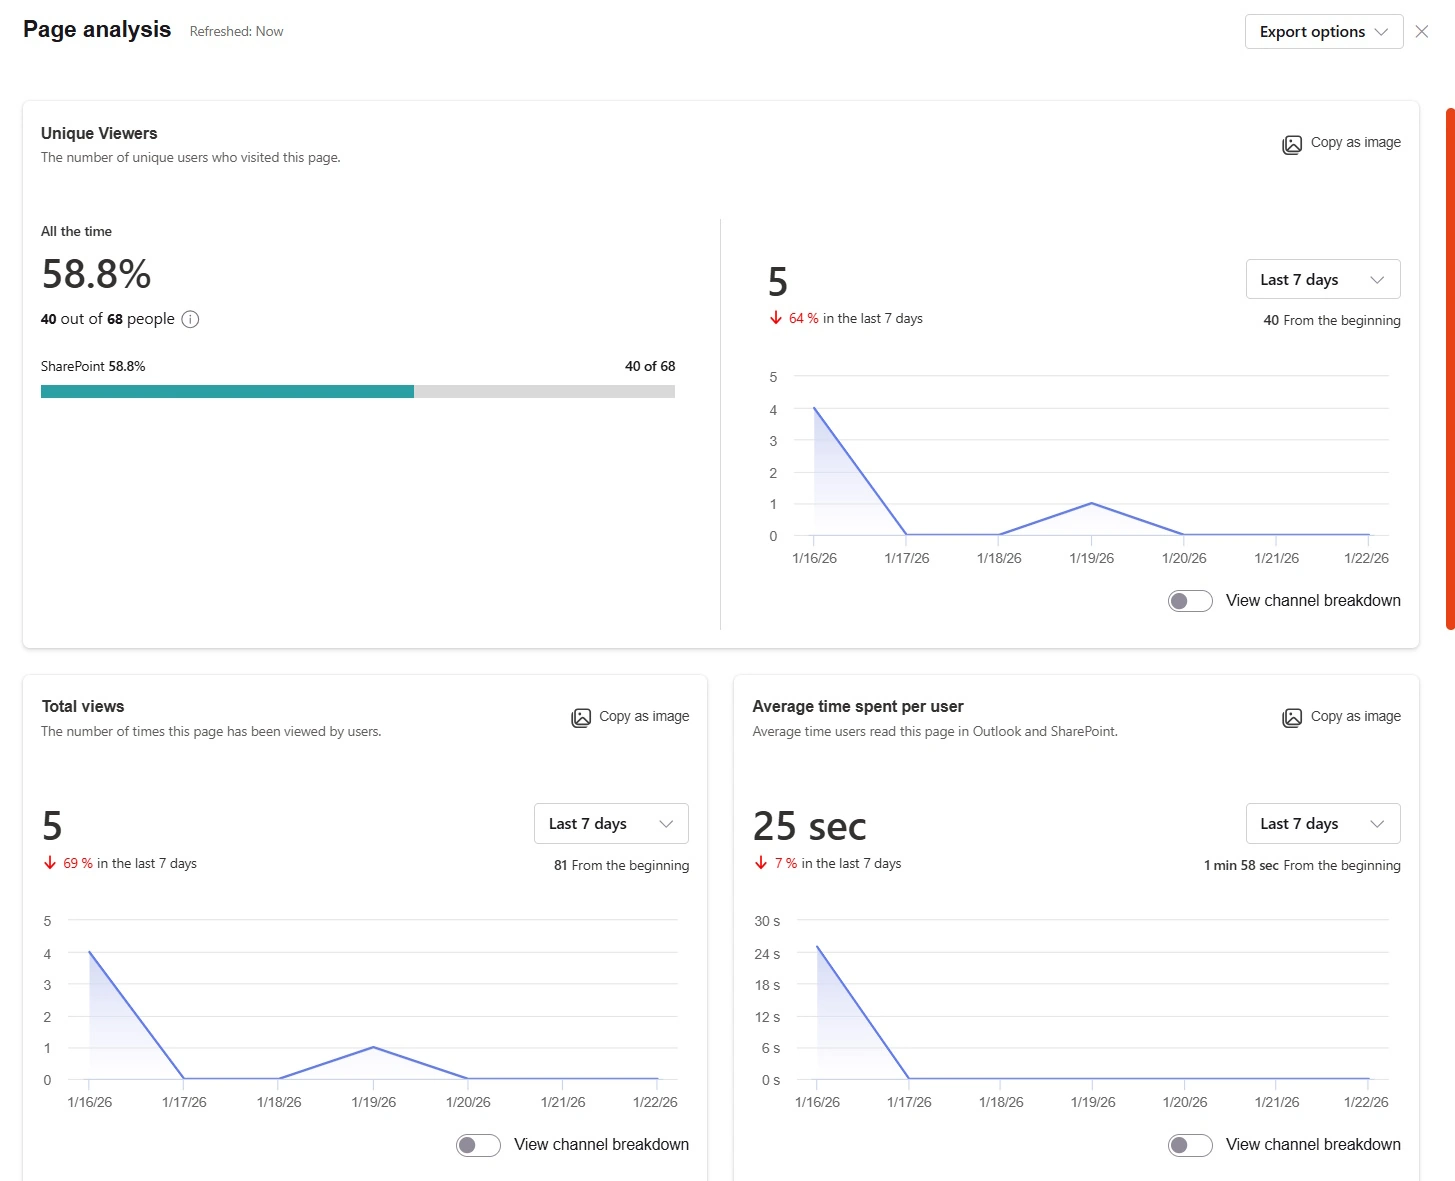
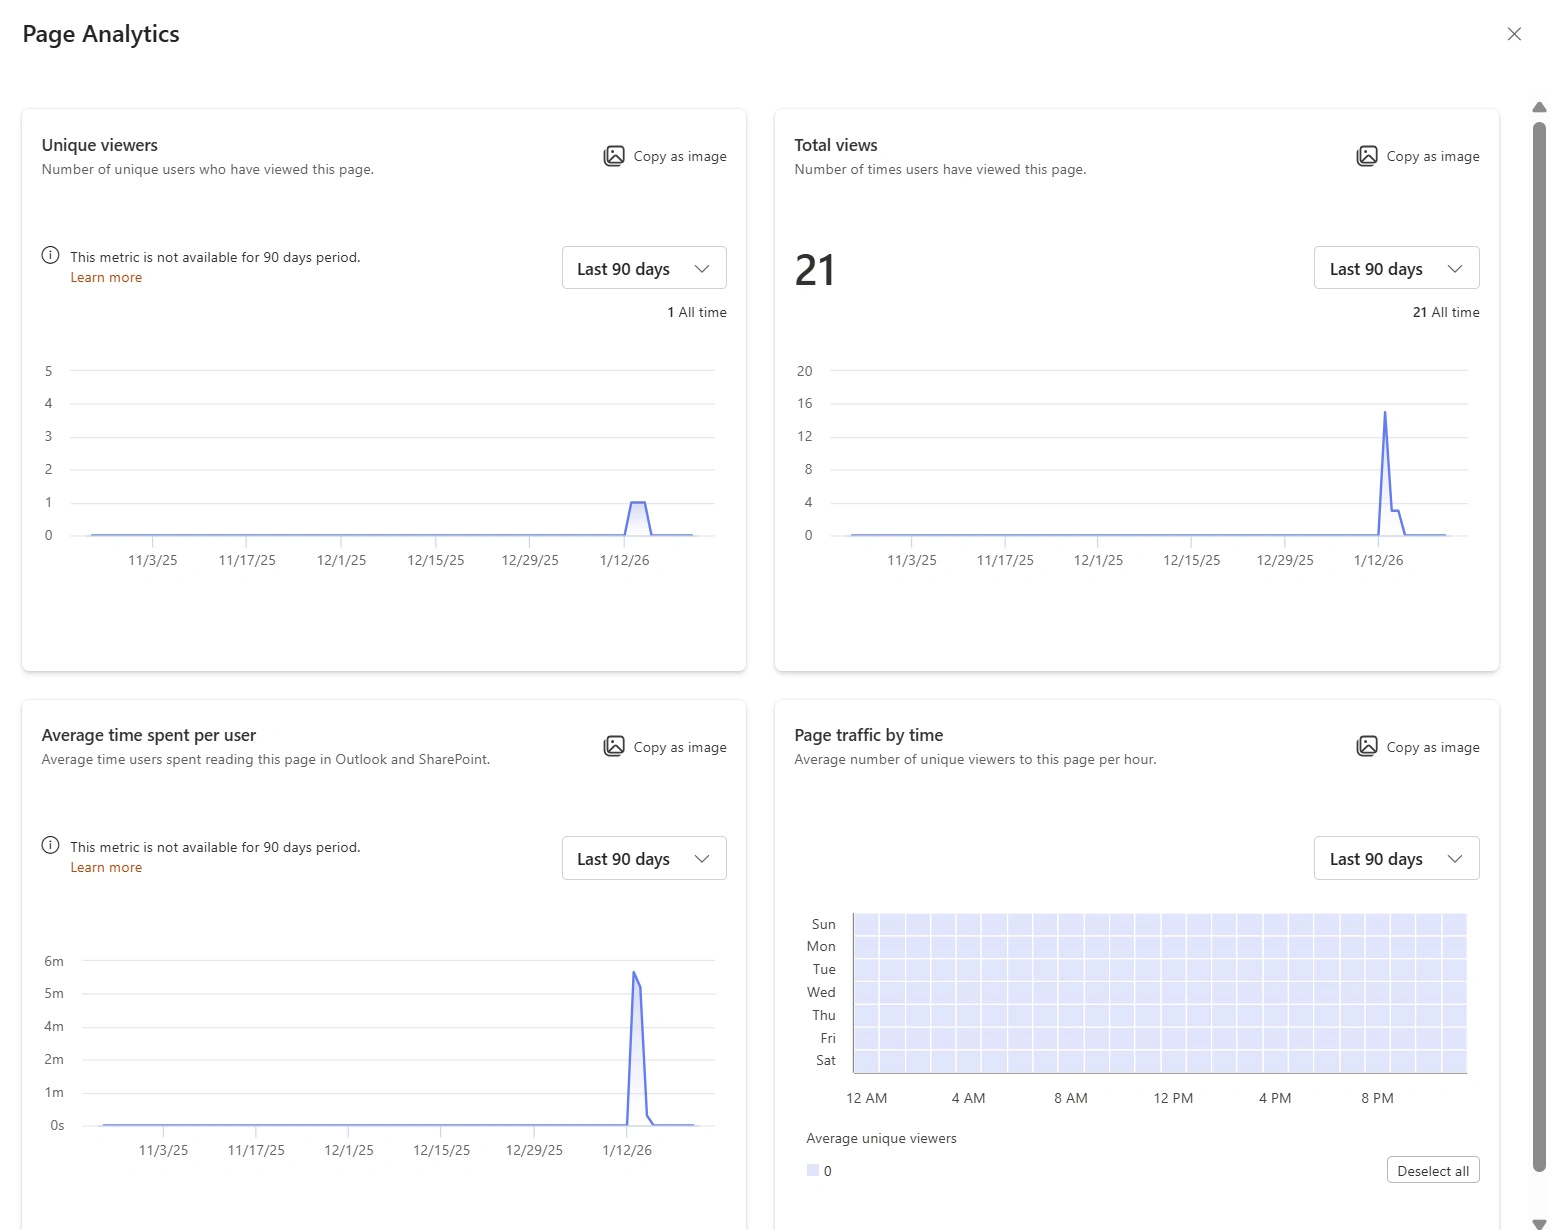
Page analytics allows you to check the performance of a specific SharePoint Page. You can see the number of unique and total views, the average time users spent, traffic by time, and the number of article promotions made.
Page usage: views, Unique visitors and average time spent
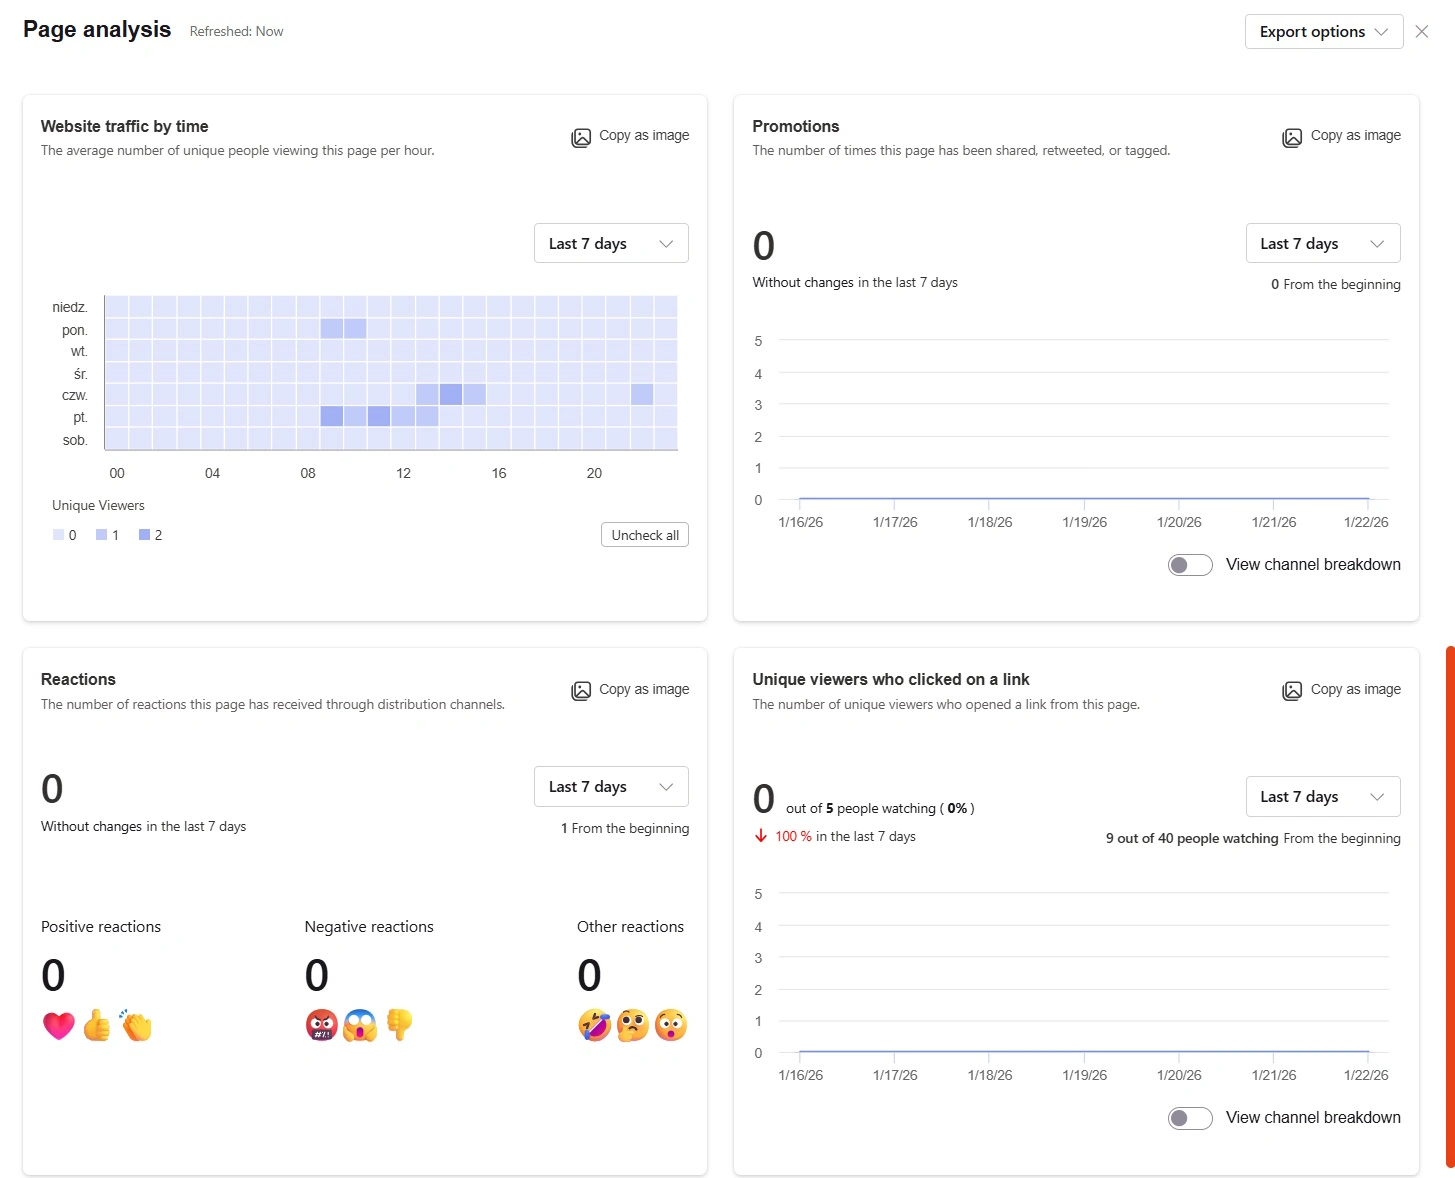
It is possible to see how effective the article is, including the click-through rate (if it contains links), readership coverage, and user reactions. You can browse the reports using different time windows, up to 12 months.
Page usage: traffic by time, promotion, reactions and click-through
⚠️ Note: As for January 2026, the most extended page analytics periods are not working yet. The new page analytics has been rolling out since September 2025, and none of the articles had enough time to gather sufficient data.
With site-level analytics, you can see how well your site performs. It allows you to see the number of unique viewers and total site visits. You can check the average time spent and visits broken down by time and device used. You can see which users access the most, so you can check the most popular resources. All in the 7-, 30-, and 90-day windows. You can also see what content external users can access, giving you the chance to improve security.
SharePoint Site Analytics Dashboard
Hub Site Analytics
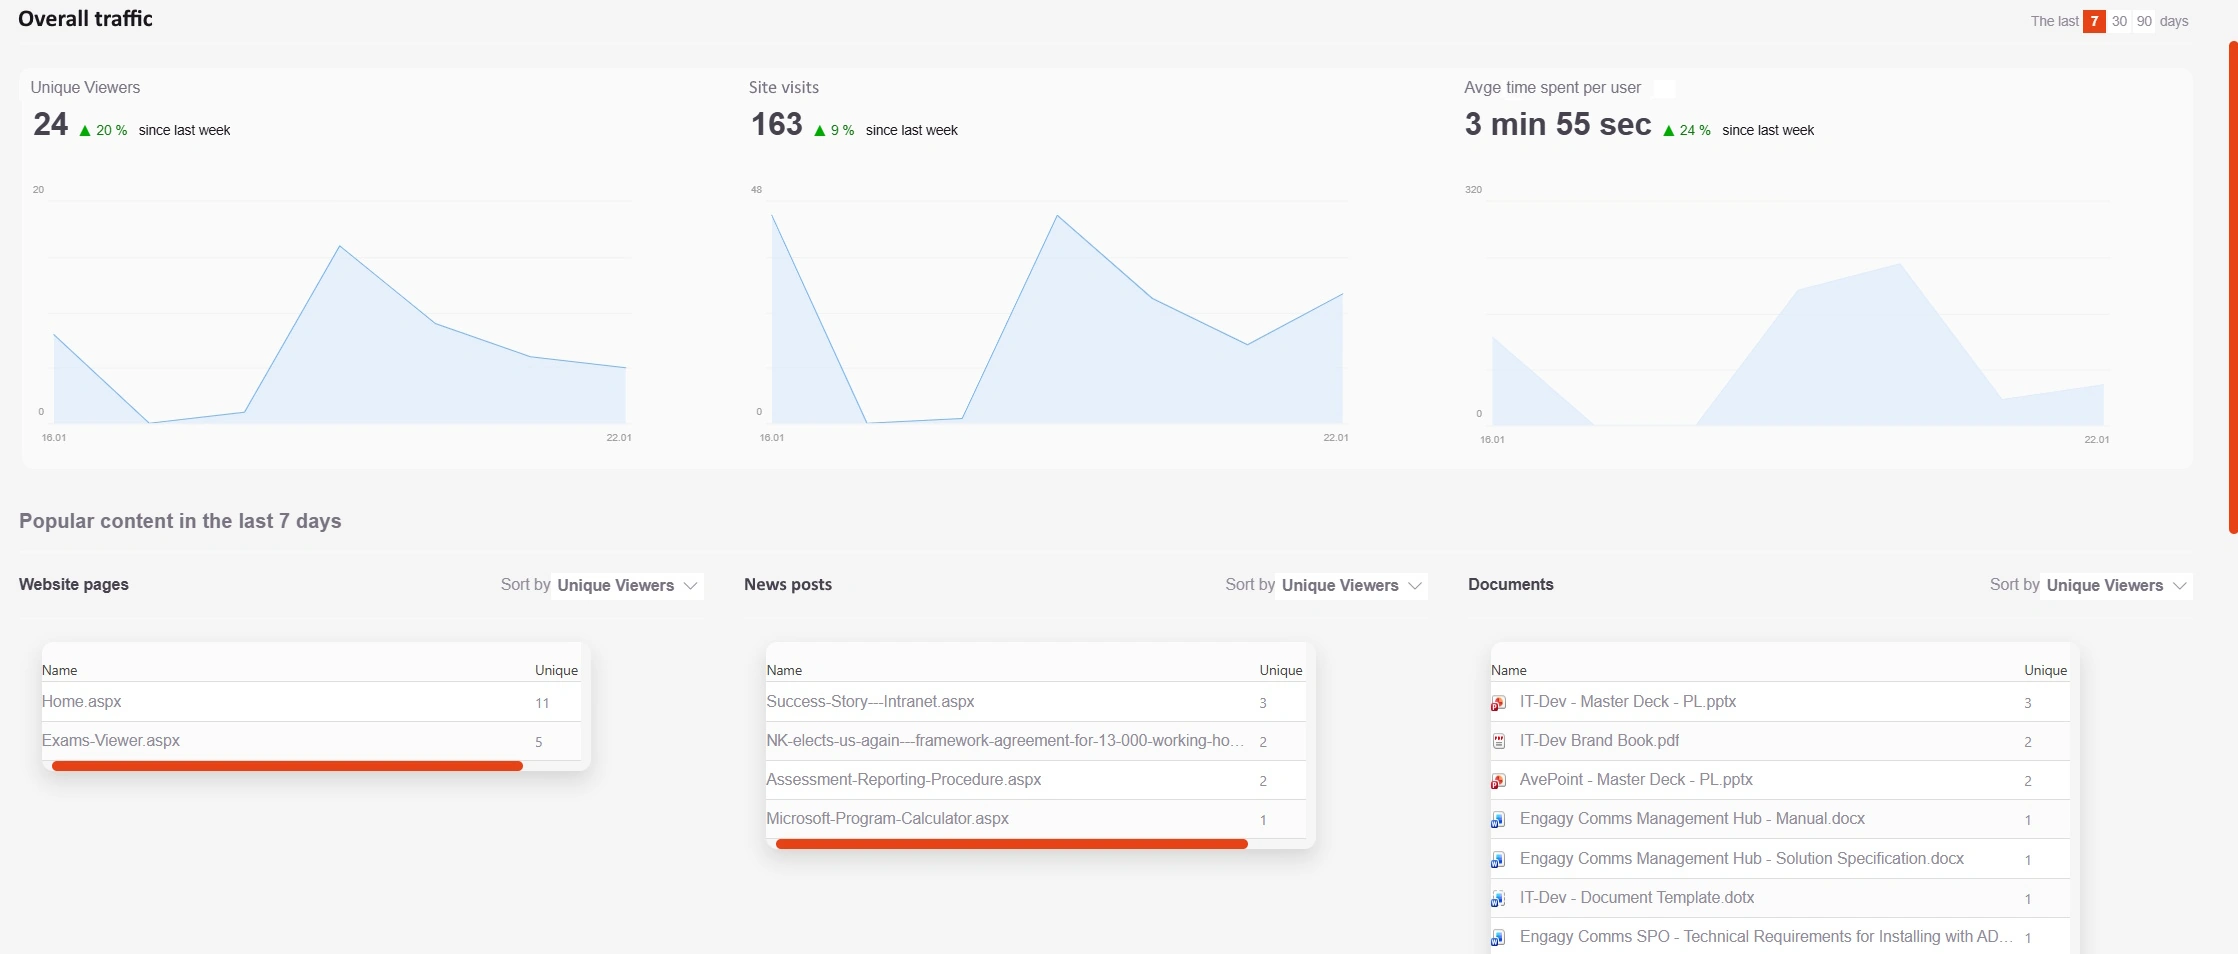
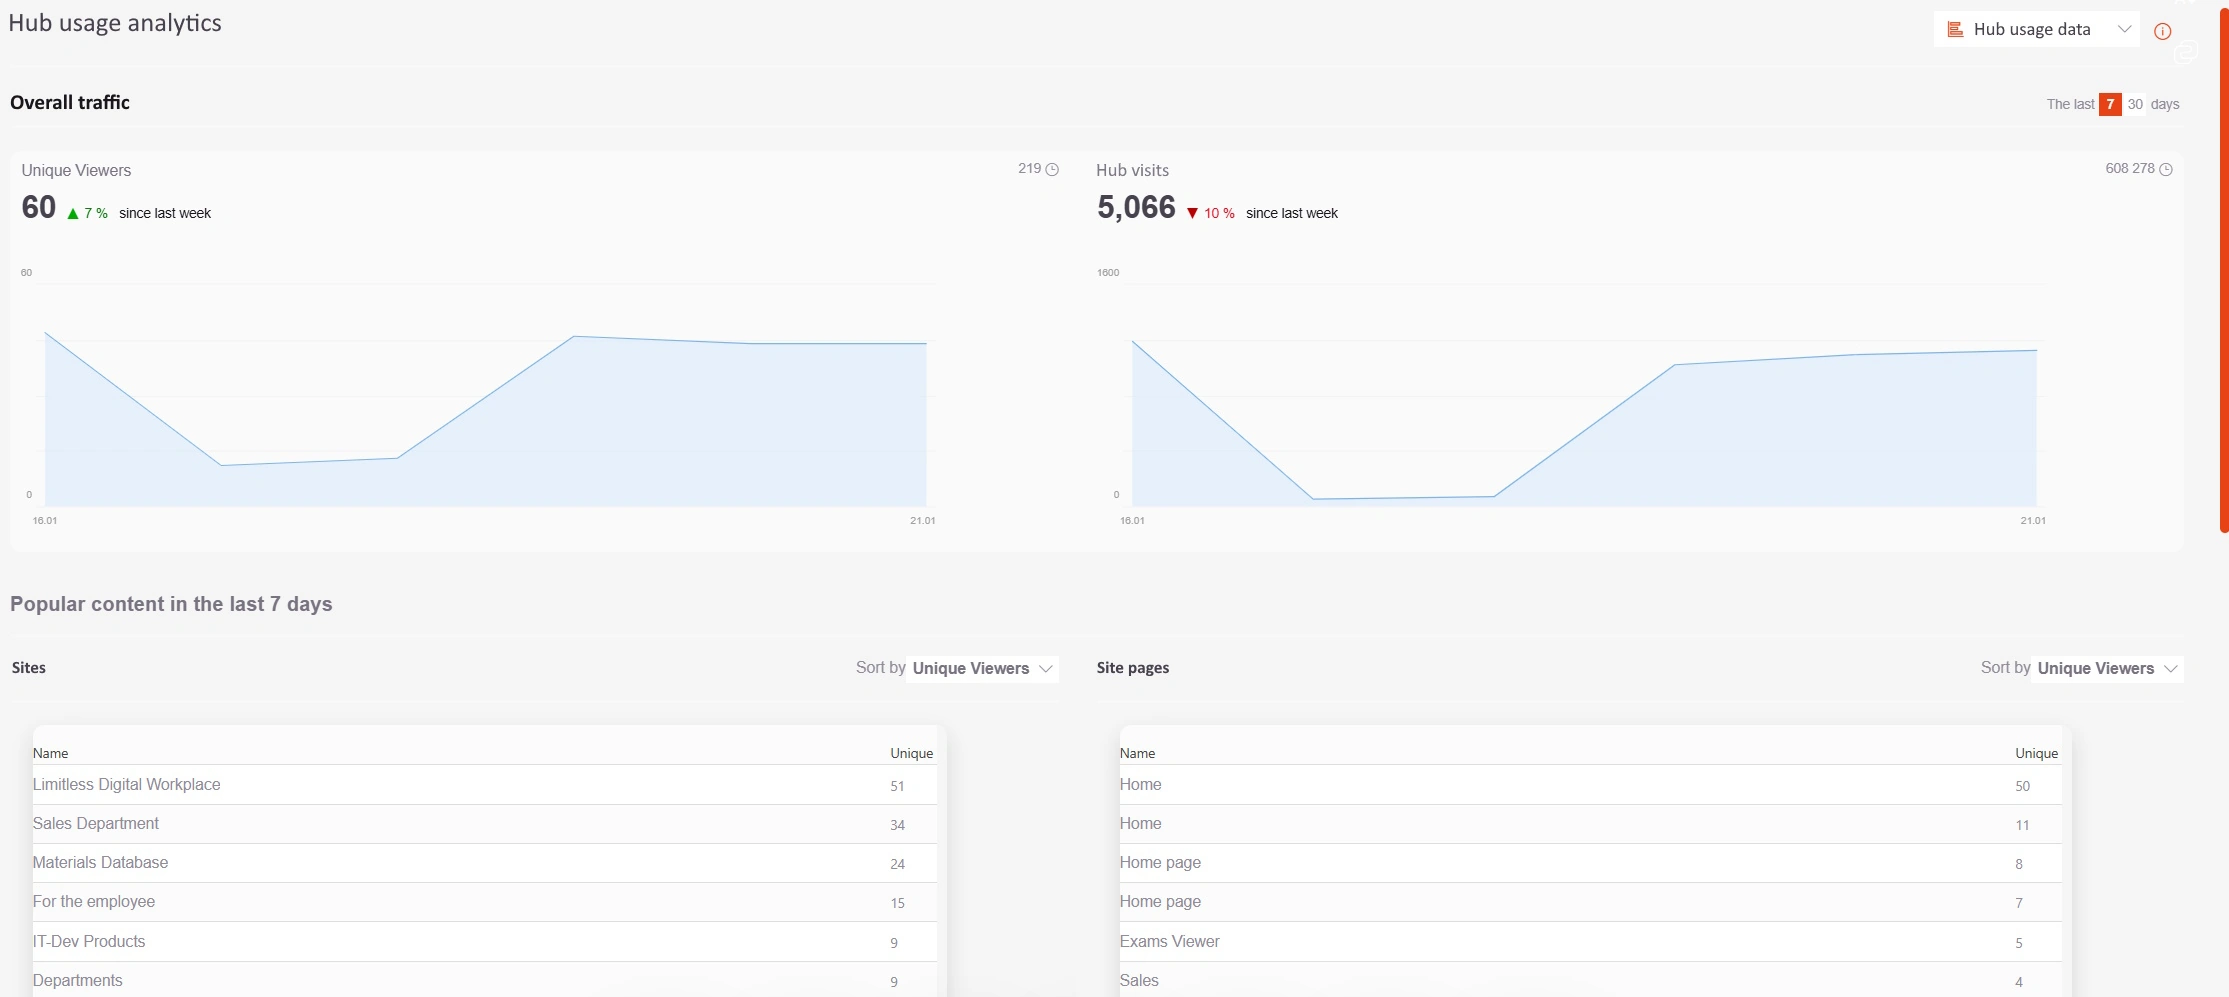
SharePoint Hub Site Analytics lets you view usage statistics across the entire hub site. You can see how many visits your hub had, both unique and total. Hub site analytics dashboard displays the most popular content: sites, pages, news, and documents. Once again, you can narrow the reports by selecting 7- or 30-day time periods.
SharePoint Hub Site Analytics Dashboard
How to Utilize SharePoint Analytics
SharePoint Insights supports intranet optimization. Use it to improve weak pages. Use it to fix navigation. You can also use it to leverage high-performing articles even more.
If a page view count is near zero, you may face a configuration issue. Users cannot find the content. Only editors access it. You may need to correct your navigation. You should also check if you properly published the article and whether the access rights are accurate.
Low unique users count may suggest publishing or access problems
If a page view count is low or users spend little time reading it, you should improve the article’s quality. It is a clear sign that users are dissatisfied with your copy. Do you deliver what users are looking for? Are you thorough with your writing? Your article may contain everything the user needs, but it is difficult to find. In that case, consider simplifying it or rearranging it.
⚠️ Note: Remember that context matters. A rarely-visited HR policy page isn’t necessarily “failing”. Only newcomers may be reading it. The same goes for low view count. The content may be self-explanatory, which is why fewer repeat visits are required. It is worth checking the unique user count as well to see if you are missing subsequent or first-time visits.
If your article scores exceptionally well on the performance table, the story is different. First of all – congratulations, good job! Review your content and identify what users find helpful. It could be the topic or the copy itself. You can apply those conclusions to articles with lower view counts.
💡 You can also use high-performing articles to promote other content as you would on your webpage. Doing so will help you improve the reach of your different pages. You can even leverage the click-through metric to see how effective you are.
It is essential to check your intranet performance metrics regularly. You need to know what is happening. Plan actions and introduce amendments. Making a habit of intranet performance tracking reduces randomness. It also makes your outcomes more predictable.
What SharePoint Analytics Reports won’t tell you
One thing is missing from SharePoint analytics functions. You can see what users read. But you do not know what they would like to read.
Balancing information supply and demand is an essential task in intranet optimization. If demand outstrips supply, users are dissatisfied because they can’t find what they need. If supply exceeds demand, you may accidentally introduce information noise. Which, in turn, bothers your users.
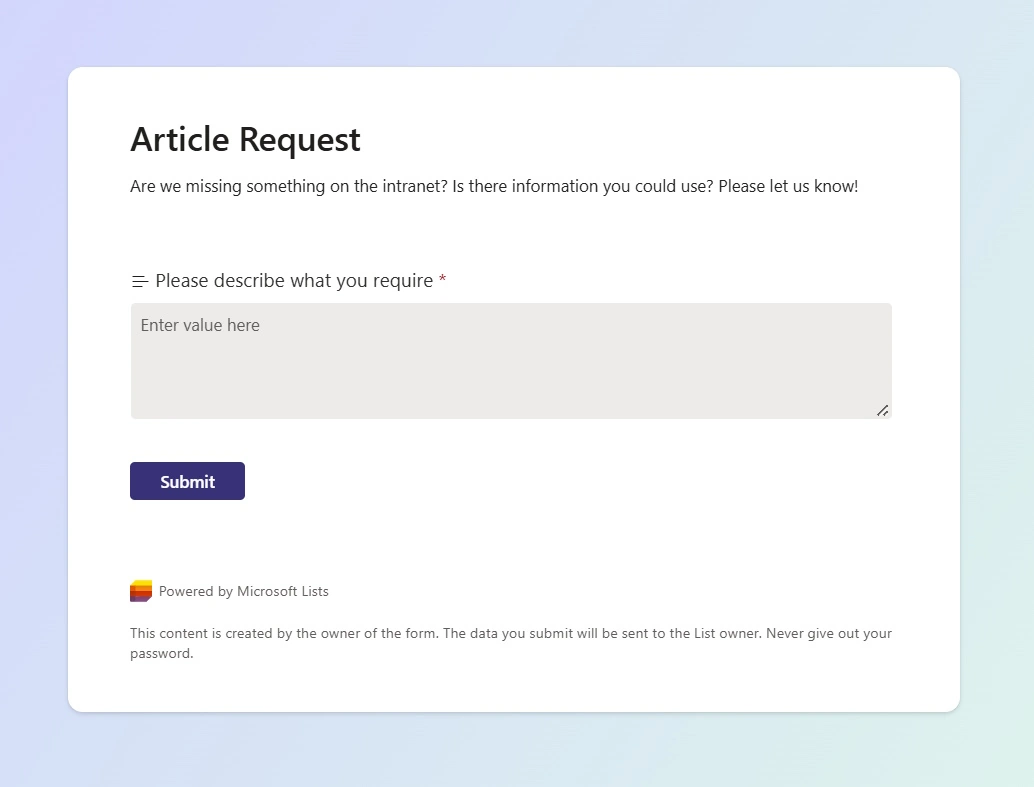
Using SharePoint’s native capabilities, it is pretty easy to create a straightforward feedback form. Users will send you information about their needs. You will be able to act on those. It is a win-win situation. You improve the quality of your portal while users feel heard, seeing their feedback turned into actual intranet resources.
SharePoint List Form for Content Requests
Advanced Reporting and External Tools
When built-in SharePoint analytics are not enough, external tools can provide deeper behavioral insights and longer data retention.
Google Analytics
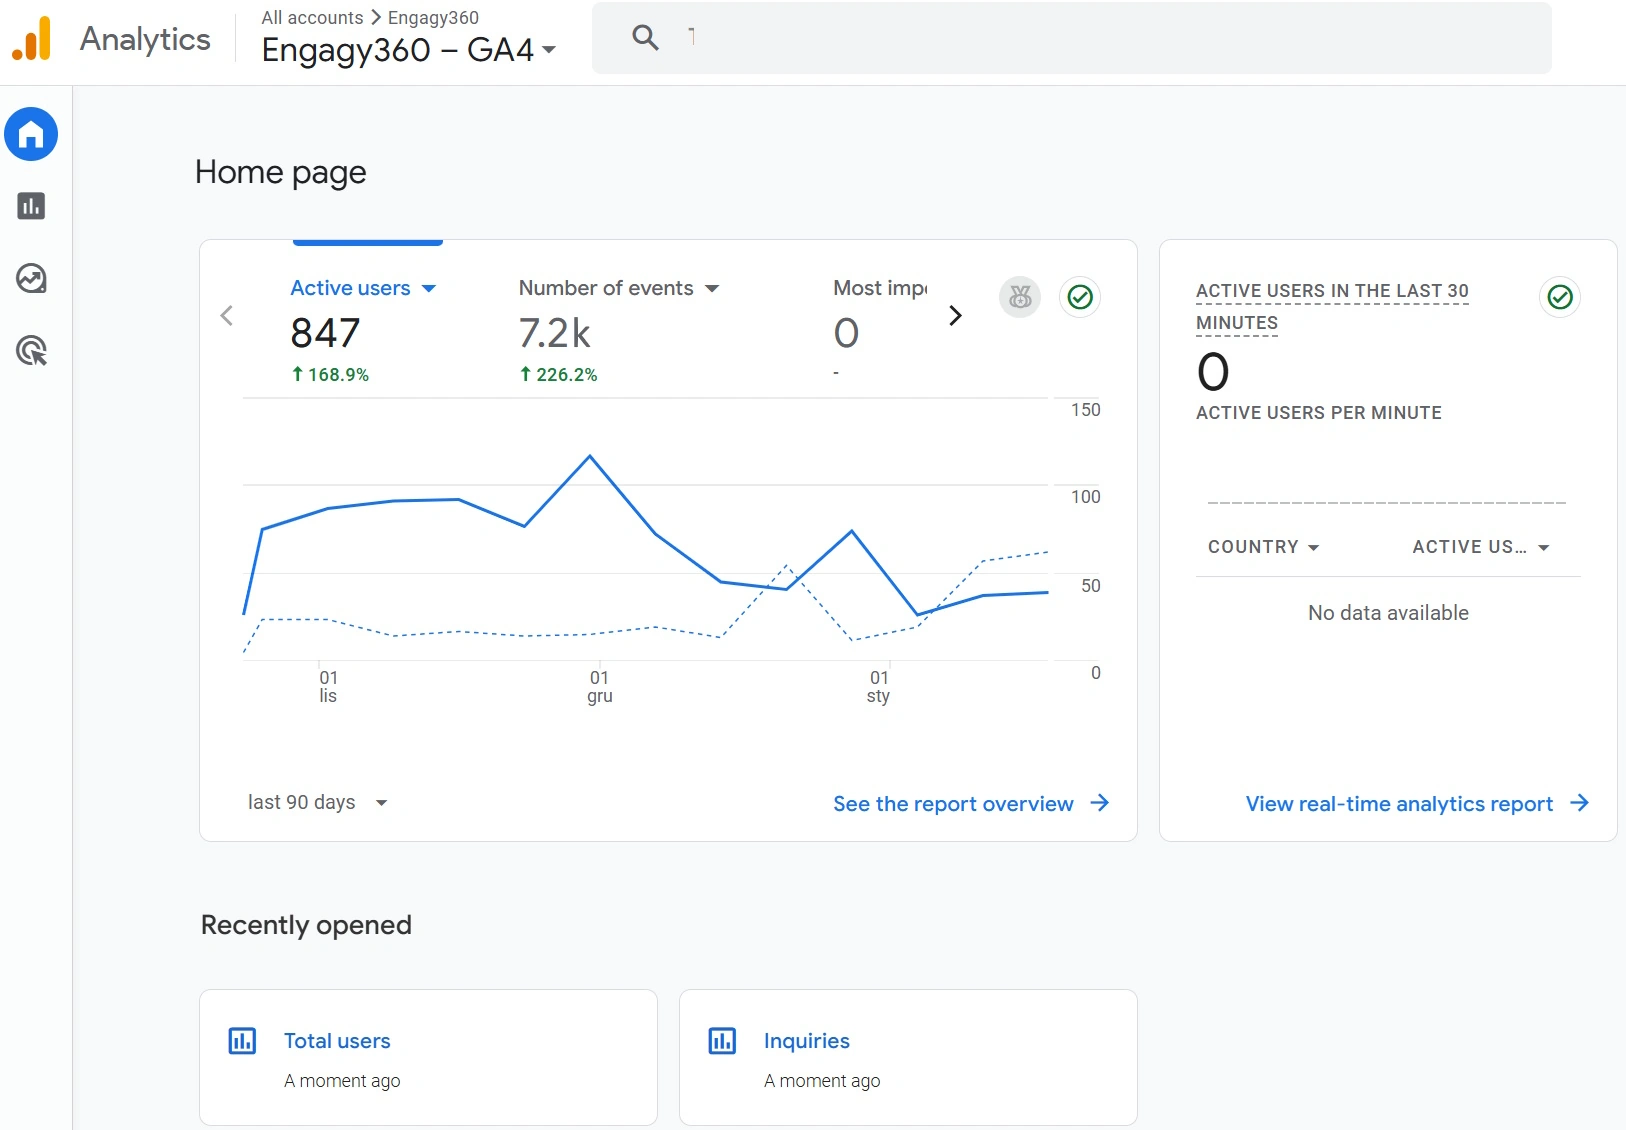
Google Analytics (GA) provides flexible tracking. It goes beyond SharePoint’s 90-day data limit. GA offers more detailed insight into user behavior. It resides outside Microsoft 365, which you must take into account.
Google Analytics
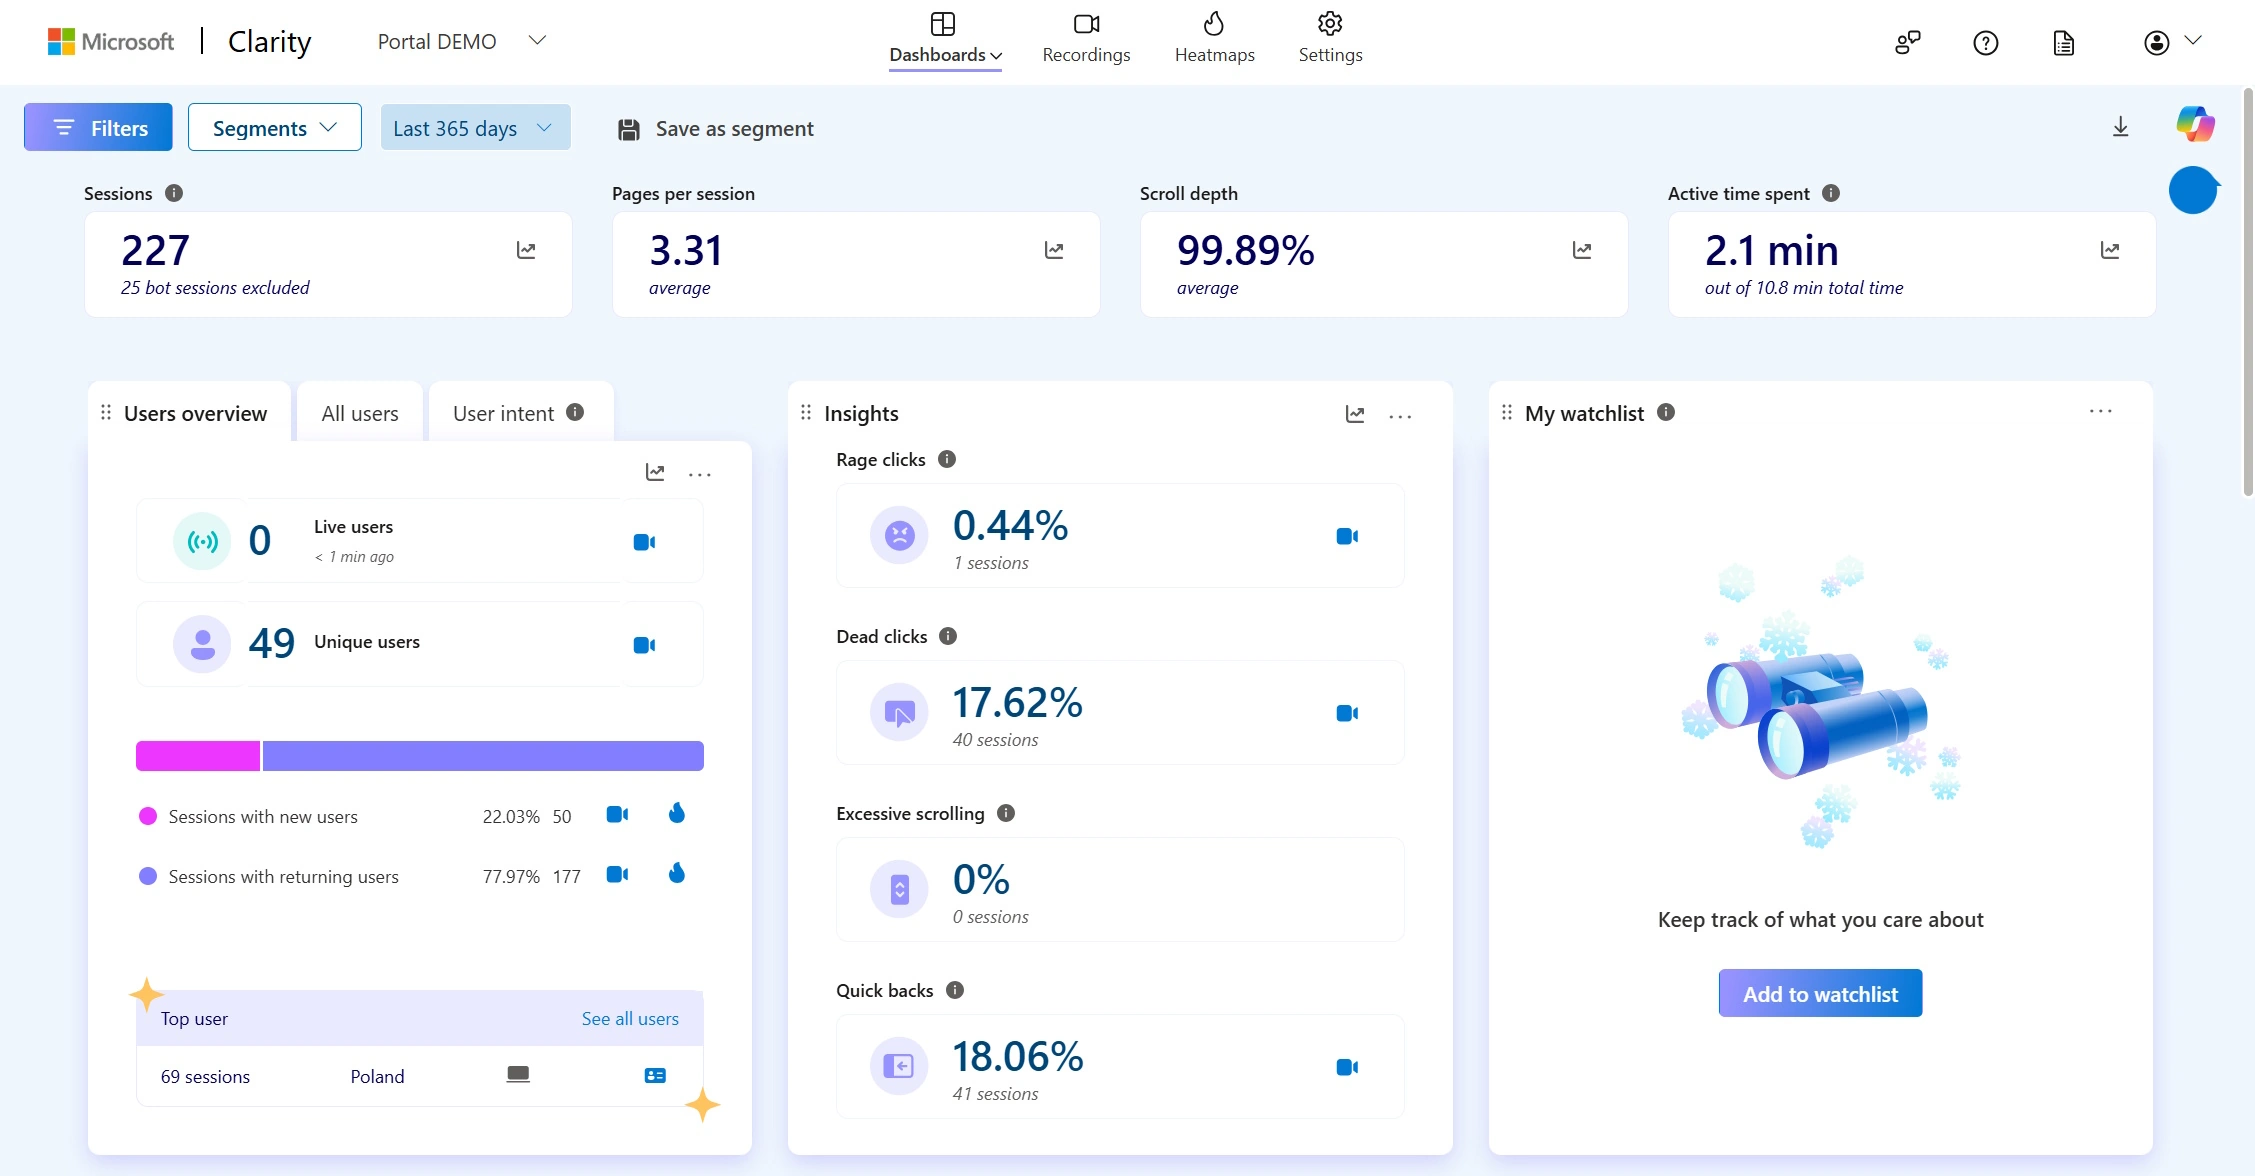
Microsoft Clarity
Microsoft Clarity improves intranets with user behavior insights. It provides heatmaps, session recordings, rage clicks, and dead clicks. You can see UX pain points beyond basic metrics, going beyond the 90-day data limit. It raises fewer privacy concerns as both Clarity and SharePoint are part of the Microsoft ecosystem.
Microsoft Clarity
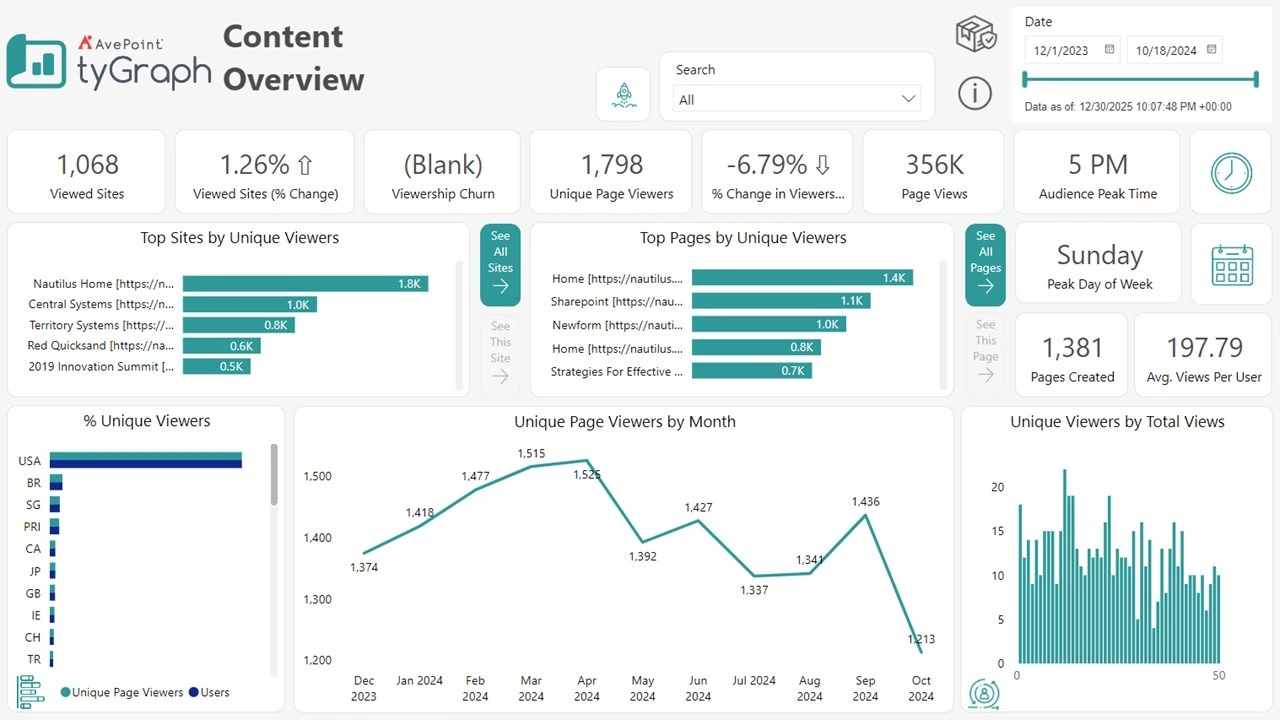
tyGraph
Offered by AvePoint, tyGraph is a workforce analytics platform. It extends the built-in capabilities of the modern SharePoint intranet. It provides comprehensive insights across Microsoft 365 tools, including SharePoint, Teams, Viva Engage, and Microsoft Copilot.
AvePoint tyGraph
See how analytics-driven intranet management helped achieve 85% adoption rate.
Engagy360
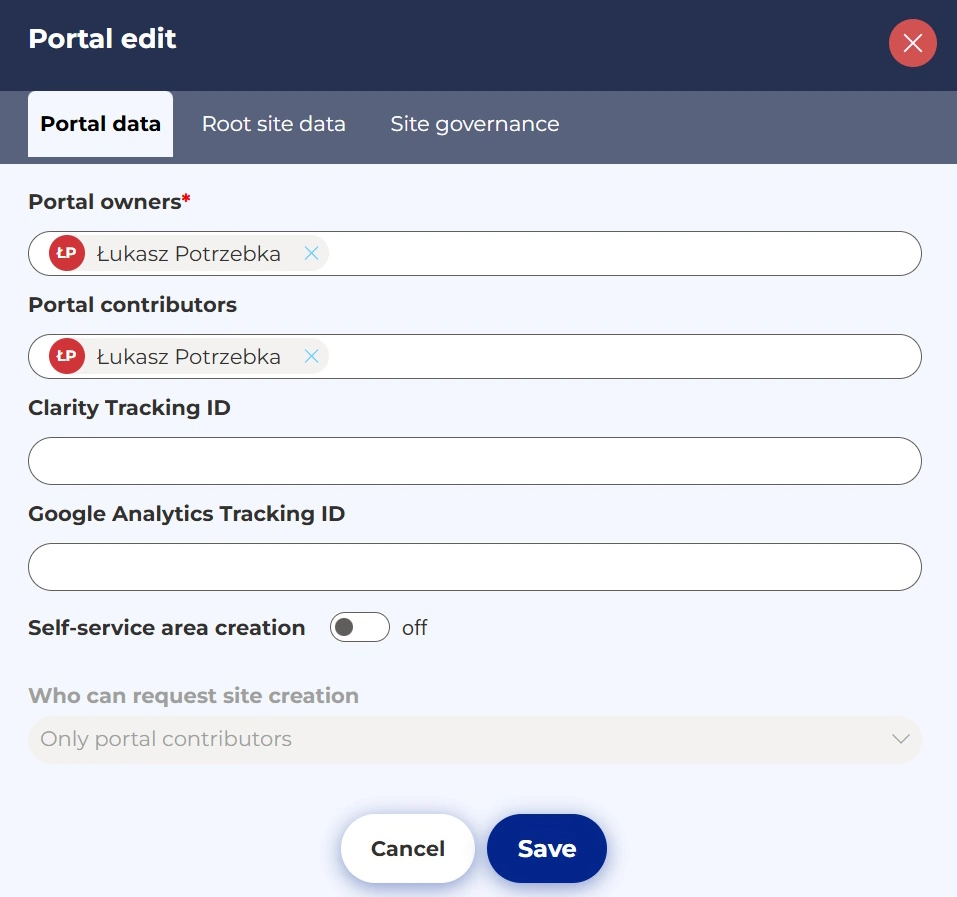
Engagy360 is not a direct SharePoint reporting tool. It can, however, help you integrate Google Analytics and Microsoft Clarity into your intranet. You do not need technical skills to do it, since there is no development involved.
Engagy360 Analytics Integration
⚠️ Note: Microsoft introduces Content Security Policy (CSP). It helps protect against code injection attacks. Until February 28, 2026, CSP operates in reporting mode, but from March 1, 2026, SharePoint Online will enforce it. It may affect code extensions, such as integration with Google Analytics or Microsoft Clarity.
When You Should Start Using SharePoint Analytics
As quickly as you can. If your portal is already live, check intranet metrics today. The sooner you notice the trends, the sooner you can act on them. And if you are still planning your intranet launch, drive intranet adoption with data. Set clear goals for the whole portal and individual articles as well. And check how you perform each week. The simple truth is that when you keep a close eye on your intranet metrics, they tend to perform better.
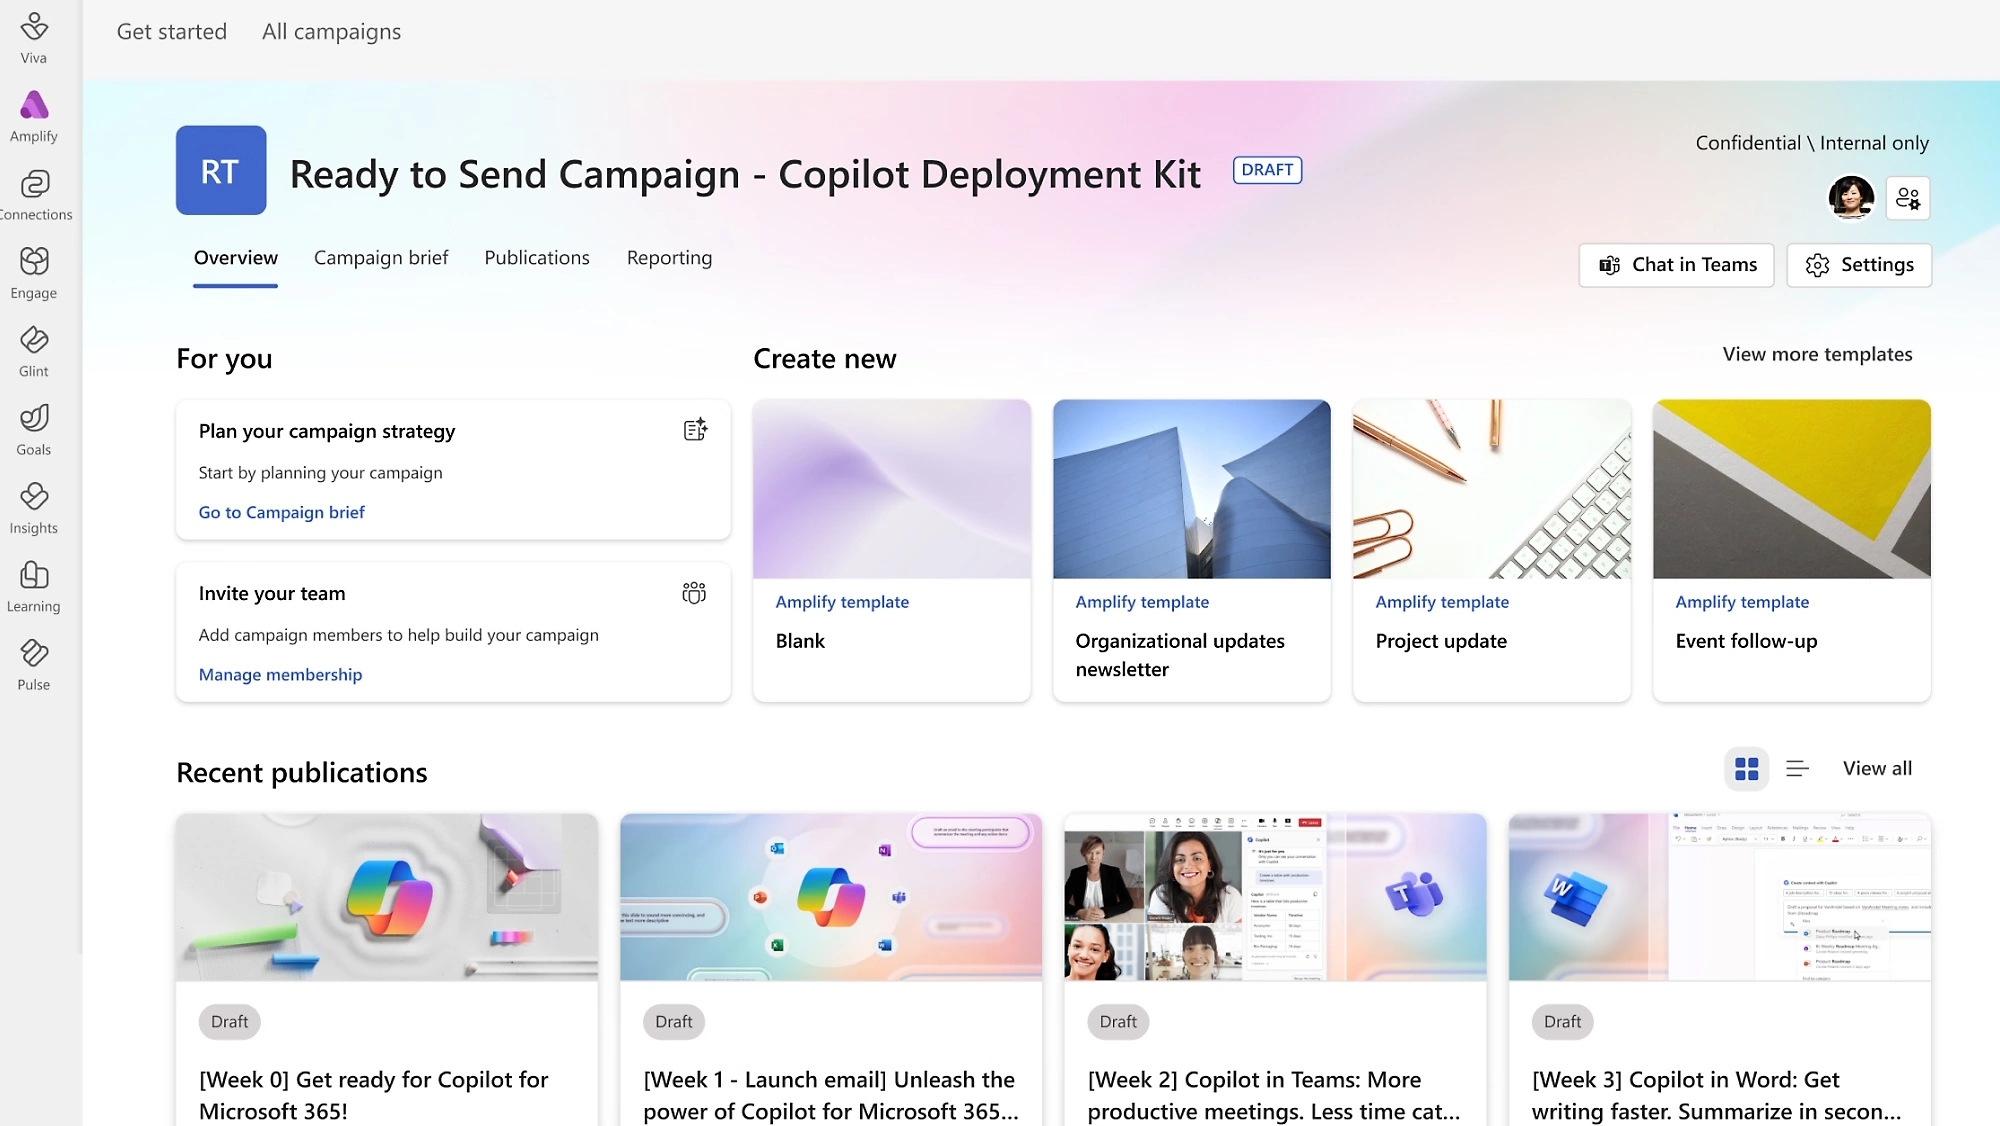
Viva Amplify Helps with Organized Intranet Adoption
If you are looking for a tool to support your intranet adoption, consider Viva Amplify. Viva Amplify enables you to send messages to your company across different channels, including SharePoint, email, Teams, and Viva Engage. You create campaigns (sets of messages for a goal) and publications (the actual messages). Editorial teams can work together to develop and publish these messages. You can track your campaign’s performance to maximize its effectiveness.
Frequently Asked Questions about SharePoint Analytics
What intranet metrics can SharePoint measure out of the box?
SharePoint enables you to see intranet usage at the page, site, and hub levels. You can track metrics such as page views, unique viewers, time spent on content, popular pages, and traffic trends over time.
What are the limitations of SharePoint Analytics Tools?
The key limitation is the lack of insight into user intent and information needs. While you can see what users read and how often, you cannot directly measure what content they were looking for. In addition, reporting windows are limited.
How to access SharePoint Usage Reporting Tools?
You can find links and buttons embedded into the SharePoint interface. You can display page analytics from either the bottom of the page, using the eye icon, or from the top action bar - by clicking the Analytics button. You can access site and hub analytic reports by selecting the Site usage option from the 'gear icon' menu.
Also, make sure you are an editor. Readers do not see all analytic options.
How can SharePoint Analytics help demonstrate intranet ROI?
Analytics helps link intranet operations to business outcomes. You can check if users actually use the portal in their daily work. Engagement with key pages and readership coverage are key metrics here. They show improvements in communication reach and content relevance.
Should I extend SharePoint Analytics with external tools?
It depends. You should consider external tools when you need longer historical data or deeper behavioral insights.
Securing ROI and Long-Term Intranet Value
Improve your intranet ROI. Start tracking metrics immediately and review them regularly. According to Nielsen Norman Group, frequency of use is a critical intranet metric. Regular performance checks indicate that working with the intranet has become a workflow habit rather than a sequence of one-off activities. And as case studies show, data-driven management focused on outcomes rather than features leads to better adoption, which is key to an effective intranet.
Analytics tell you what’s happening. Governance ensures it keeps happening. Learn how to sustain your intranet’s performance with governance best practices.
Łukasz Potrzebka
Product & Service Portfolio Lead at IT-Dev
For over 16 years, he has been working on providing solutions for customers using Microsoft technologies. For 5 years, he has been building Digital Workplaces based on the Microsoft cloud.
See your intranet come to life before you commit. With Engagy360, you don’t just imagine your ideal digital workplace. You get a working prototype tailored to your organization, ready to explore and test. Schedule a demo and see your intranet in action!
We serve cookies. If you think that's ok, just click "Accept all". You can also choose what kind of cookies you want by clicking "Settings".
Read our cookie policy